danpeg
New Member

- Total Posts : 52
- Reward points : 0
- Joined: 2021/06/02 15:16:31
- Status: offline
- Ribbons : 0

Re: Estimate your 3080 Ti via graph!
2021/07/21 16:52:25
(permalink)
Update 7-21-2021. 3959 started slow but continues steeply. If the trend continues I may eliminate the first two date points from the regression. The Hydro Coppers must have had less sign ups. Their slopes look nice and steep.
|
rzelek506
iCX Member

- Total Posts : 303
- Reward points : 0
- Joined: 2021/05/20 19:44:12
- Status: offline
- Ribbons : 2

Re: Estimate your 3080 Ti via graph!
2021/07/21 17:19:01
(permalink)
danpeg
Update 7-21-2021. 3959 started slow but continues steeply. If the trend continues I may eliminate the first two date points from the regression. The Hydro Coppers must have had less sign ups. Their slopes look nice and steep.
Thanks for the update!
|
danpeg
New Member
- Total Posts : 52
- Reward points : 0
- Joined: 2021/06/02 15:16:31
- Status: offline
- Ribbons : 0
Re: Estimate your 3080 Ti via graph!
2021/07/22 15:54:40
(permalink)
Update 7-22-2021: Added dashed lines of the same color to show the previous regression so you can see the action from the latest drop. Let me know if you think its a good addition. Good action on 3959, you can see the slope steepen a lot!
|
razor_pk
New Member
- Total Posts : 100
- Reward points : 0
- Joined: 2008/01/14 03:54:26
- Status: offline
- Ribbons : 0
Re: Estimate your 3080 Ti via graph!
2021/07/23 11:11:23
(permalink)
|
danpeg
New Member
- Total Posts : 52
- Reward points : 0
- Joined: 2021/06/02 15:16:31
- Status: offline
- Ribbons : 0
Re: Estimate your 3080 Ti via graph!
2021/07/24 07:32:23
(permalink)
razor_pk
whats this tool name ?
Just using gnuplot.
|
danpeg
New Member
- Total Posts : 52
- Reward points : 0
- Joined: 2021/06/02 15:16:31
- Status: offline
- Ribbons : 0
Re: Estimate your 3080 Ti via graph!
2021/08/03 08:13:24
(permalink)
Update 8-2-2021: Slow week last week. The SC3 HC did get another good jump. Time wise on the queue I believe it will surpass all the others.
|
danpeg
New Member
- Total Posts : 52
- Reward points : 0
- Joined: 2021/06/02 15:16:31
- Status: offline
- Ribbons : 0
Re: Estimate your 3080 Ti via graph!
2021/08/05 10:11:04
(permalink)
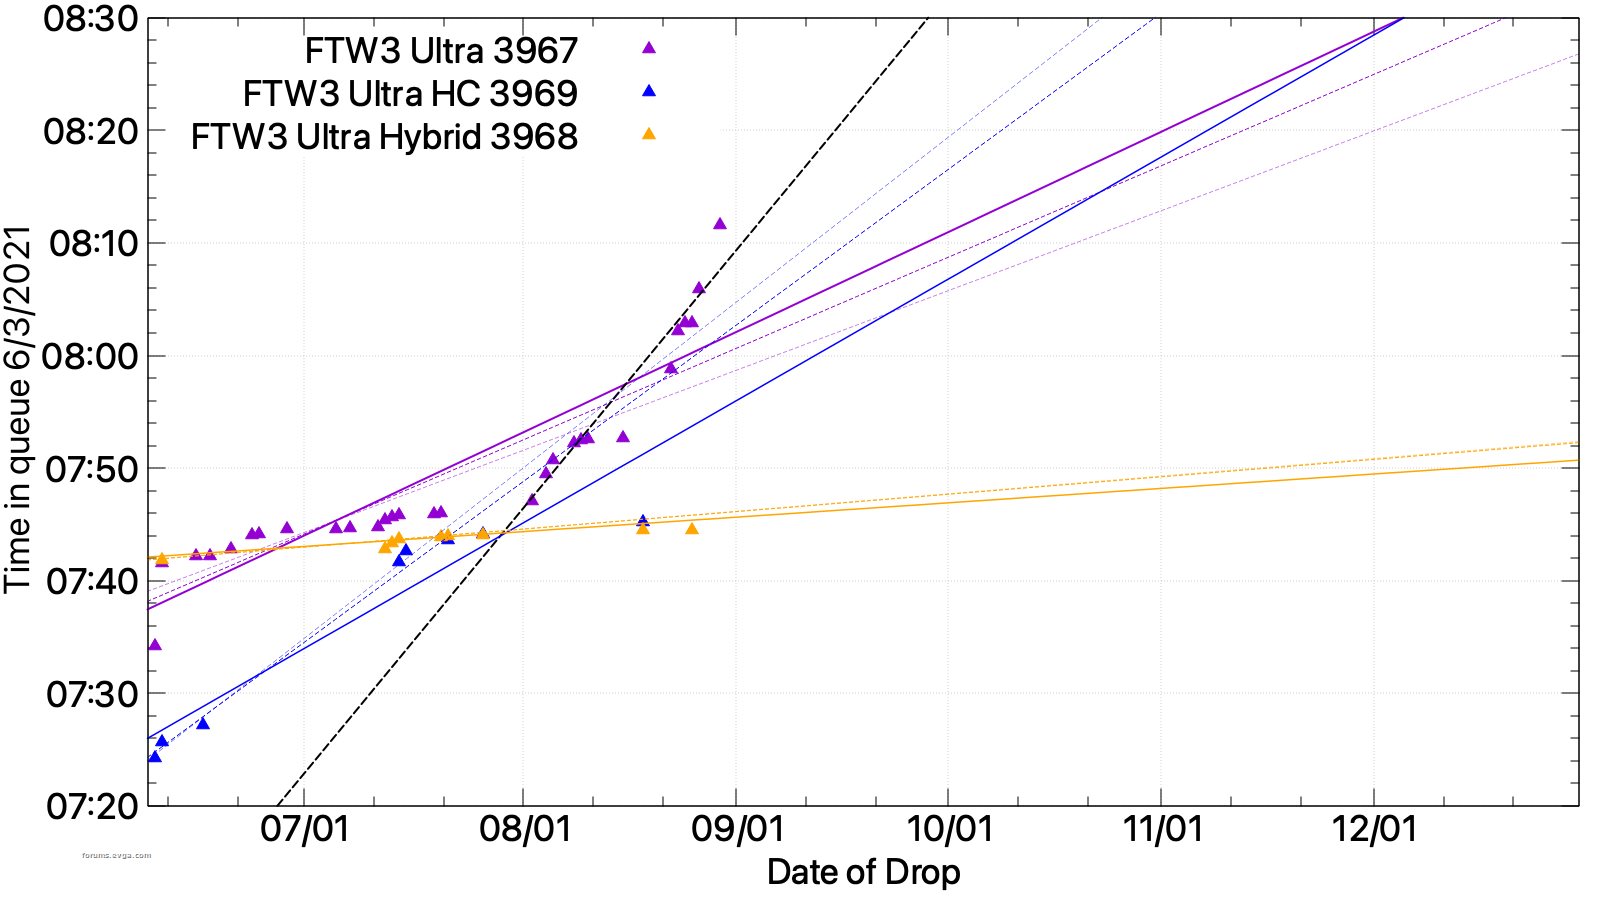
Attached is a graph of drops for various 3080 Ti cards.
Update 8-5-2021: After a slow week, the flagship 3967 took a nice 2+ min leap. The solid purple line is mostly hiding under the red line.
Notes: First data point for 3967 not included in regression line as it appears to be an outlier.
Solid lines are the current regression. Heavy dotted lines are the previous regression. Light dotted lines are the regression prior to that.
|
danpeg
New Member
- Total Posts : 52
- Reward points : 0
- Joined: 2021/06/02 15:16:31
- Status: offline
- Ribbons : 0
Re: Estimate your 3080 Ti via graph!
2021/08/05 17:40:36
(permalink)
Attached is a graph of drops for various 3080 Ti cards.
Update 8-5-2021: After a slow week, the flagship 3967 took a nice 2+ min leap. The solid purple line is mostly hiding under the red line.
Update 2: 3958 also took a leap. Lets hope this keeps up.
Notes: First data point for 3967 not included in regression line as it appears to be an outlier.
Solid lines are the current regression. Heavy dotted lines are the previous regression. Light dotted lines are the regression prior to that.
|
rzelek506
iCX Member
- Total Posts : 303
- Reward points : 0
- Joined: 2021/05/20 19:44:12
- Status: offline
- Ribbons : 2
Re: Estimate your 3080 Ti via graph!
2021/08/05 17:46:27
(permalink)
danpeg
Attached is a graph of drops for various 3080 Ti cards.
Update 8-5-2021: After a slow week, the flagship 3967 took a nice 2+ min leap. The solid purple line is mostly hiding under the red line.
Update 2: 3958 also took a leap. Lets hope this keeps up.
Notes: First data point for 3967 not included in regression line as it appears to be an outlier.
Solid lines are the current regression. Heavy dotted lines are the previous regression. Light dotted lines are the regression prior to that.
Great job, keep it up!
|
danpeg
New Member
- Total Posts : 52
- Reward points : 0
- Joined: 2021/06/02 15:16:31
- Status: offline
- Ribbons : 0
Re: Estimate your 3080 Ti via graph!
2021/08/10 08:28:27
(permalink)
Update 8-9-2021: 3967 and 3958 took good jumps speeding both up. 
Attached Image(s)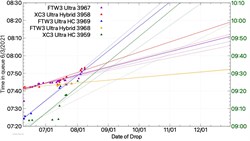
|
danpeg
New Member
- Total Posts : 52
- Reward points : 0
- Joined: 2021/06/02 15:16:31
- Status: offline
- Ribbons : 0
Re: Estimate your 3080 Ti via graph!
2021/08/12 07:37:08
(permalink)
Attached is a graph of drops for various 3080 Ti cards.
Update 8-11-2021: 3967 and 3958 keep getting bumps.
Notes: First data point for 3967 not included in regression line as it appears to be an outlier.
Solid lines are the current regression. Heavy dotted lines are the previous regression. Light dotted lines are the regression prior to that.
|
kevinc313
CLASSIFIED ULTRA Member

- Total Posts : 5004
- Reward points : 0
- Joined: 2019/02/28 09:27:55
- Status: offline
- Ribbons : 22
Re: Estimate your 3080 Ti via graph!
2021/08/12 07:54:18
(permalink)
|
DonaldTheGiver
New Member
- Total Posts : 49
- Reward points : 0
- Joined: 2012/02/16 06:19:41
- Status: offline
- Ribbons : 0
Re: Estimate your 3080 Ti via graph!
2021/08/12 10:26:43
(permalink)
This graph is making it look like some people might be lucky to get picked in que by maybe 2025 when 5x series comes around, oof.
|
kevinc313
CLASSIFIED ULTRA Member
- Total Posts : 5004
- Reward points : 0
- Joined: 2019/02/28 09:27:55
- Status: offline
- Ribbons : 22
Re: Estimate your 3080 Ti via graph!
2021/08/19 17:00:58
(permalink)
Bump for an underrated thread. Gave up on waiting til the end of the year for the 3968 and ordered a 3090 bundle. Thanks OP!
|
rzelek506
iCX Member
- Total Posts : 303
- Reward points : 0
- Joined: 2021/05/20 19:44:12
- Status: offline
- Ribbons : 2
Re: Estimate your 3080 Ti via graph!
2021/08/19 17:09:51
(permalink)
kevinc313
Bump for an underrated thread. Gave up on waiting til the end of the year for the 3968 and ordered a 3090 bundle. Thanks OP!
Agreed! Hope OP continues to update this graph!
|
danpeg
New Member
- Total Posts : 52
- Reward points : 0
- Joined: 2021/06/02 15:16:31
- Status: offline
- Ribbons : 0
Re: Estimate your 3080 Ti via graph!
2021/08/19 17:27:35
(permalink)
Update 8-19-2021: 3958 got a good bump. 3968 is slowing down. 
Attached Image(s)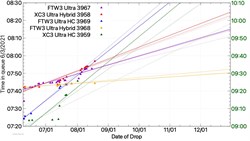
|
rzelek506
iCX Member
- Total Posts : 303
- Reward points : 0
- Joined: 2021/05/20 19:44:12
- Status: offline
- Ribbons : 2
Re: Estimate your 3080 Ti via graph!
2021/08/19 17:47:45
(permalink)
danpeg
Update 8-19-2021: 3958 got a good bump. 3968 is slowing down.

Thanks for the update!
|
danpeg
New Member
- Total Posts : 52
- Reward points : 0
- Joined: 2021/06/02 15:16:31
- Status: offline
- Ribbons : 0
Re: Estimate your 3080 Ti via graph!
2021/08/27 16:01:31
(permalink)
rzelek506
Thanks for the update!
The graph looks great, but I think the graph is getting to a point where it is getting too cluttered to show all of the SKUs in one graph.
My recommendation would be to separate them so there is only one graph per SKU or to only show one line per SKU, if that makes sense.
Yes it is a bit cluttered. I might break them up. What I really wanted an opinion on is the new black line. Its a regression on just the last month of data on the 3967 instead of regressing from the beginning. Sure looks like we have enough data points this month on this one to argue a new trend. What do you think?
|
sweeetah
New Member
- Total Posts : 100
- Reward points : 0
- Joined: 2021/08/27 08:36:09
- Status: offline
- Ribbons : 0
Re: Estimate your 3080 Ti via graph!
2021/08/27 16:06:49
(permalink)
|
rzelek506
iCX Member
- Total Posts : 303
- Reward points : 0
- Joined: 2021/05/20 19:44:12
- Status: offline
- Ribbons : 2
Re: Estimate your 3080 Ti via graph!
2021/08/27 16:33:52
(permalink)
danpeg
rzelek506
Thanks for the update!
The graph looks great, but I think the graph is getting to a point where it is getting too cluttered to show all of the SKUs in one graph.
My recommendation would be to separate them so there is only one graph per SKU or to only show one line per SKU, if that makes sense.
Yes it is a bit cluttered. I might break them up. What I really wanted an opinion on is the new black line. Its a regression on just the last month of data on the 3967 instead of regressing from the beginning. Sure looks like we have enough data points this month on this one to argue a new trend. What do you think?
Yeah, I agree that the new black line is pretty good and also more realistic than the older line for that SKU.
|
danpeg
New Member
- Total Posts : 52
- Reward points : 0
- Joined: 2021/06/02 15:16:31
- Status: offline
- Ribbons : 0
Re: Estimate your 3080 Ti via graph!
2021/08/31 09:27:33
(permalink)
Attached is a graph of drops for various 3080 Ti cards. Update 8-30-2021: The flagship 3967 keeps jumping. There are many drops on the flagship 3967 and there appears to be an increase in going through the queue for it beginning 8/1. So, the black dashed line is the alternate regression line which is of course, much more optimistic for us! Lets hope this keeps up.   Solid lines are the current regression. Heavy dotted lines are the previous regression. Light dotted lines are the regression prior to that.
Attached Image(s)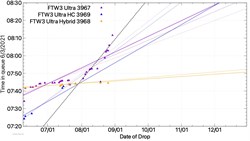 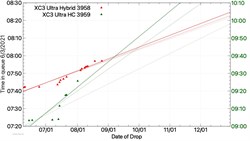
|
rzelek506
iCX Member
- Total Posts : 303
- Reward points : 0
- Joined: 2021/05/20 19:44:12
- Status: offline
- Ribbons : 2
Re: Estimate your 3080 Ti via graph!
2021/08/31 09:45:09
(permalink)
danpeg
Attached is a graph of drops for various 3080 Ti cards.
Update 8-30-2021: The flagship 3967 keeps jumping.
There are many drops on the flagship 3967 and there appears to be an increase in going through the queue for it beginning 8/1. So, the black dashed line is the alternate regression line which is of course, much more optimistic for us! Lets hope this keeps up.

Solid lines are the current regression. Heavy dotted lines are the previous regression. Light dotted lines are the regression prior to that.
Looks great!
|
famich
Superclocked Member

- Total Posts : 193
- Reward points : 0
- Joined: 2009/03/09 07:54:25
- Status: offline
- Ribbons : 1
Re: Estimate your 3080 Ti via graph!
2021/09/01 12:30:32
(permalink)
INTEL 12900KS at 5700, allcore 5450 GSKILL 4000 DDR32Gb ASUS STRIX Z690 DR4 ASUS RTX 3090 OC STRIX LianLi
|
danpeg
New Member
- Total Posts : 52
- Reward points : 0
- Joined: 2021/06/02 15:16:31
- Status: offline
- Ribbons : 0
Re: Estimate your 3080 Ti via graph!
2021/09/07 21:43:52
(permalink)
Attached is a graph of drops for various 3080 Ti cards. Update 9-07-2021 The 3967 continues up at breakneck speed. Might have to change the scale soon. That is good news for all. The XC3 line has not changed since last week.  Solid lines are the current regression. Heavy dotted lines are the previous regression. Light dotted lines are the regression prior to that.
Attached Image(s)
|
danpeg
New Member
- Total Posts : 52
- Reward points : 0
- Joined: 2021/06/02 15:16:31
- Status: offline
- Ribbons : 0
Re: Estimate your 3080 Ti via graph!
2021/09/19 20:54:57
(permalink)
Cant seem to upload images right now. Anyone else having this problem?
|
Nozler
CLASSIFIED Member

- Total Posts : 2058
- Reward points : 0
- Joined: 2009/10/28 10:51:49
- Location: Ottertail county,Minnesota,USA
- Status: offline
- Ribbons : 1
Re: Estimate your 3080 Ti via graph!
2021/09/20 00:06:39
(permalink)
When I first saw the post it was an entire wall of text 
|
XrayMan
Insert Custom Title Here

- Total Posts : 63846
- Reward points : 0
- Joined: 2006/12/14 22:10:06
- Location: Santa Clarita, Ca.
- Status: offline
- Ribbons : 115
Re: Estimate your 3080 Ti via graph!
2021/09/20 00:09:57
(permalink)
Seriously. All the same graphs over and over. Thread cleaned up. That's enough man.
My Affiliate Code: 8WEQVXMCJL Associate Code: VHKH33QN4W77V6A   
|
danpeg
New Member
- Total Posts : 52
- Reward points : 0
- Joined: 2021/06/02 15:16:31
- Status: offline
- Ribbons : 0
Re: Estimate your 3080 Ti via graph!
2021/09/20 08:16:31
(permalink)
XrayMan
Seriously. All the same graphs over and over. Thread cleaned up. That's enough man.
Well actually, anytime I put up another graph, there is new data from new drops on the graphs and the regression lines are recalculated. The wall of text occurred when I tried dragging the figure onto this reply. Normally I click the 'upload figure' button but all weekend I just get a spinning symbol and the file doesn't upload.
|
Kasque
New Member
- Total Posts : 100
- Reward points : 0
- Joined: 2021/09/20 14:36:42
- Status: offline
- Ribbons : 0
Flagged as Spam (3)
Re: Estimate your 3080 Ti via graph!
2021/09/23 07:14:10
(permalink)
damned, good work, thanks !
|
danpeg
New Member
- Total Posts : 52
- Reward points : 0
- Joined: 2021/06/02 15:16:31
- Status: offline
- Ribbons : 0
Re: Estimate your 3080 Ti via graph!
2021/10/11 12:41:39
(permalink)
Attached is a graph of drops for various 3080 Ti cards. Update 10-10-2021. Well, I have finally given up on EVGA fixing their file upload. I've email support and all I ever get is to try another browser, or clear my cache. Never works of course. So I'm hosting the images elsewhere. The flagship keeps forging ahead and the XC3 Ultra HC is doing well too. The others, well not too much love from EVGA. 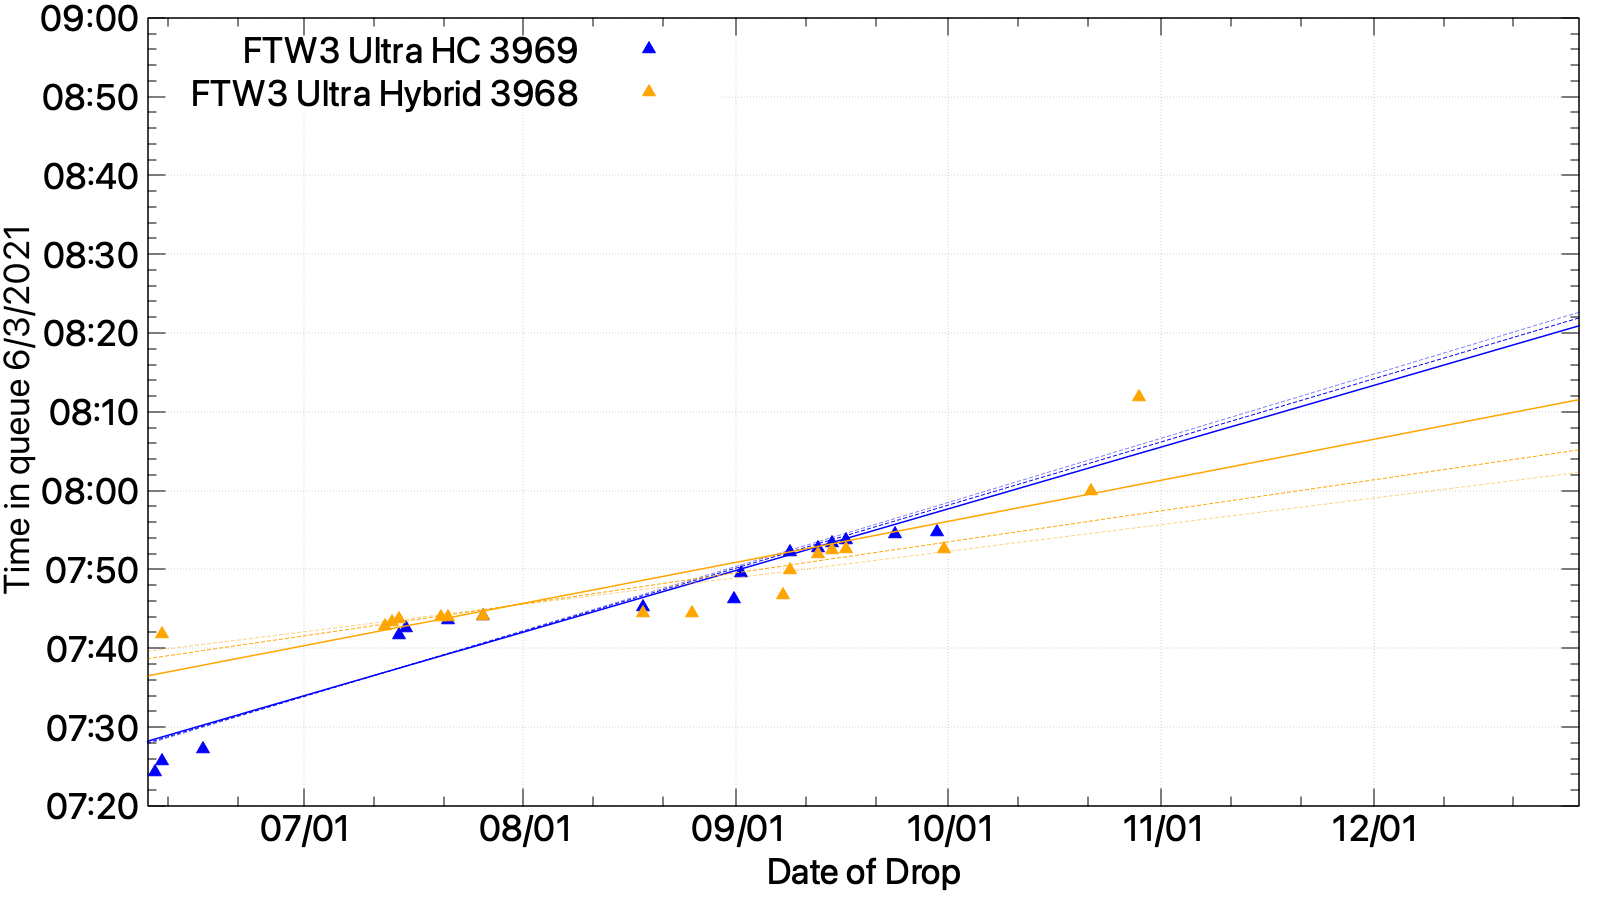 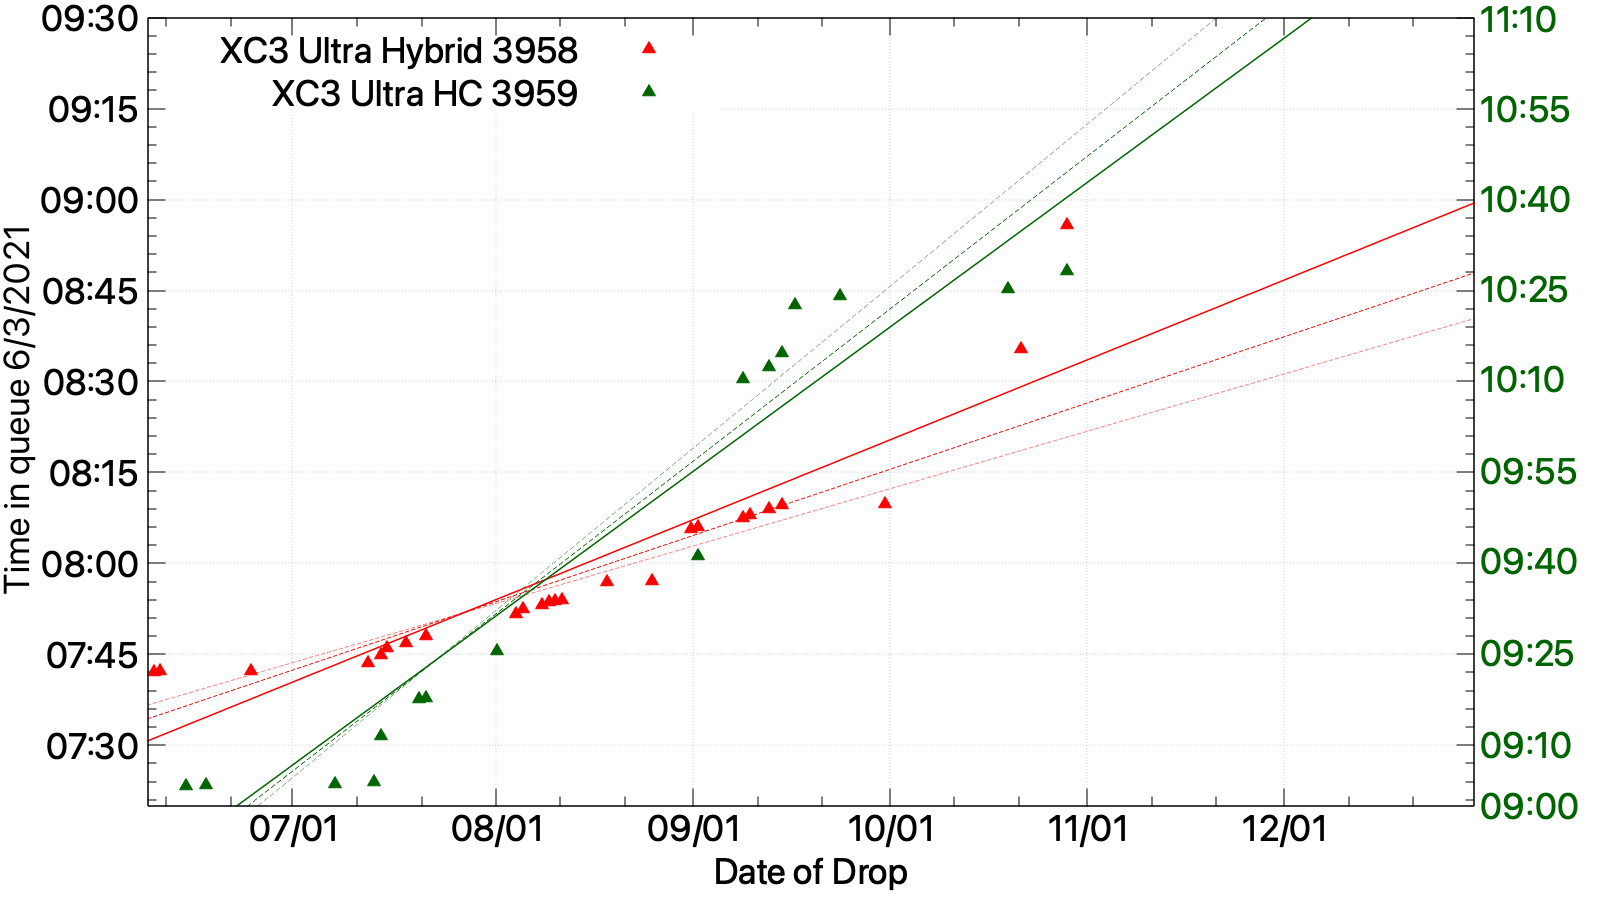 Solid lines are the current regression. Heavy dotted lines are the previous regression. Light dotted lines are the regression prior to that.
|